A few days ago, all the parts arrived for a brand-new Kaby Lake Core i7-7700K build. Soon enough, a shiny black PC stood before me, assembled, and beckoned me to turn it on. And turn it on, I did. After marveling at how fast it booted, the first order of business was benchmarking!
There are a lot of benchmarks to run out there, but the one that I find fascinating is the program you can download from http://cpu.userbenchmark.com — The website takes data from each person who runs the benchmark and then loads the results into a giant database from which you, the user, can then compare your results against, including parts and processors that you don’t own.
When the benchmark program was run on the new Core i7, many scores came out on top, but a few were marked “performing worse than expected”. Fortunately, there were some easy fixes.
About the Benchmarks
Let us take a close look at the benchmarks starting with the Graphics card which performed well:
As shown above, the AMD R9 380 video card performs above expectations and if you look carefully, you can see one bell curve and this card is on the right side of the bell curve, meaning that it performs above average compared to all other cards of this type (R9 380).
Nothing to fix here, so next is:
Memory
What’s fascinating about this benchmark is that although it says that the memory is performing as expected (compared to other people using the same Corsair DDR4 3000 memory), there are two distinct bell curves!
Every data point in this graph consists of people with very fast DDR4 3000 memory. The bell curve on the left of the graph is a “slower” group while the bell curve on the right of the graph is a “faster” group. In other words:
The people in the left bell-curve are doing something wrong while the people on the right have their memory configured optimally.
Why two groups of users? What’s the difference?
The people in the slow group have their motherboards configured for the “safe” default settings. Specifically, the motherboard is set to run the memory at the JEDEC standard which is 2133 Mhz.
Programmed into every stick of DDR4 RAM is a memory profile which details the memory stick’s true maximum speed. In order to take advantage of this, the motherboard needs to be instructed via the BIOS to use the “XMP” (eXtreme Memory Profile.)
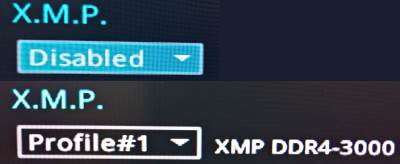
As shown in the screenshot of the UEFI/BIOS, there is a drop-down box which changes memory profile from “disabled” to “Profile #1”. This enables XMP.
After turning on XMP, we re-benchmarked the memory and it is easy to see that the memory performance has jumped dramatically and is now well in the “faster” group and “performing way above expectations”. Alright!
NVMe SSD
Introduced in the past couple years is the new M.2 NVMe PCIe interface for solid state drives. It uses 4 PCIe lanes and can push up to 32Gb/s (that’s around 4 GigaBYTES/sec for those of you who don’t think in bits.) And this is generally a good thing since SSDs have already exceeded the limits of SATA3 (6Gbps).
As shown above, the Samsung 960 Evo (500GB) has been benchmarked. Although it performs well, it still performs worse than expected.
Not just that, this drive appears to have a wide variation in its performance. But the wide bell-curve is a lie. It’s actually 2 separate bell curves, and you can kind of see a “double camel hump” happening. Simply put, the two bell curves are overlapping. And this SSD is currently performing in the middle of the “slower” group.
Why so slow?
It turns out that some NVMe SSDs actually require drivers. Well, I should say that the stock Microsoft Windows driver does not fully maximize the performance of these SSDs. It comes close. In fact it is pretty good, but it could be better.
The Samsung 950 Pro, 960 Evo, and 960 Pro are all supported by Samsung’s NVMe driver found here on the Samsung website. Also, Intel NVMe drivers for the 750 can be found here and the OCZ NVMe drivers can be found on the OCZ download page.
And as shown by the graph, with the custom Samsung NVMe SSD driver, the Samsung 960 Evo performs way above expectation now!
 Btw, if you couldn’t tell, the Samsung 960 Evo NVMe SSD is highly recommended. It offers amazing bang-for-the-buck.
2019 Update! The new Samsung 970 Evo Plus NVMe SSD is the new sweet spot for solid state drives. It performs better than the last-gen 960 Evo and it’s cheaper, too! What’s not to like?
Measurable improvments
Now that we have the RAM and the SSD operating at their maximum potential, the next question should be:
Are there any measurable or noticeable improvements?
And the answer is:
Yes, but the improvements are modest.
The difference between running your RAM at 2133 and its full speed can be seen here in LegitReviews.com article “DDR4 Memory Scaling on Intel Z170 – Finding The Best DDR4 Memory Kit Speed“. From the article:
HandBrake version 0.10.1 showed nice performance increase from DDR4-2133 to DDR4-2400 and then we see performance pretty much plateaus.
In each case, the performance bump was only between 2% to 5%. Still, it IS a measurable increase.
The same goes for the SSD running with just the stock Windows driver or the custom driver. In all the simple tests we could think of, there wasn’t a dramatic difference.
Still… Isn’t it nice to know that your gear is running at its full potential? 🙂